
The new Business Central release, BC 23, has been available since October. The new version comes with many improvements and new functions. We would like to take this opportunity to introduce you to a special feature of Business Central:
Reporting and data analysis in BC
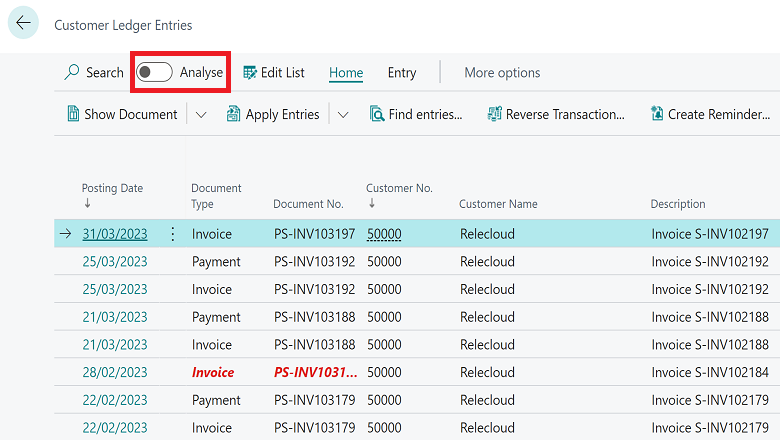
The new analysis feature in the latest BC version allows you to create and use pivot tables. Pivot tables are a powerful and flexible way to analyse and visualize data from different sources. They allow you to quickly and easily perform evaluations in different dimensions without changing the underlying data.
With the new analysis feature, you can create pivot tables directly in BC by dragging and dropping the available fields of the raw data to the value field ranges of a pivot table. You can also use the field settings on the right-hand side to determine the data arrangement. You can use fields with numbers, text values or time values to display your data in the row, column or value areas. You can also apply filters to see only the data you are interested in.
Would you like to find out more about the new analysis options in Microsoft Dynamics Business Central?
Get in touch with us! Our consultants will be happy to support you or answer any initial questions you may have.
Tel.: 089 - 211 11 848 or e-mail to vertrieb@br-ag.com.